What is all this "Calculus" stuff good for, hmm? It has to lead to ... something, right?
Try this:
Fourier transform spectroscopy is a measurement technique whereby spectra are collected based on measurements of the coherence of a radiative source, using time-domain or space-domain measurements of the electromagnetic radiation or other type of radiation. It can be applied to a variety of types of spectroscopy including optical spectroscopy, infrared spectroscopy (FTIR, FT-NIRS), nuclear magnetic resonance(NMR) and magnetic resonance spectroscopic imaging (MRSI),[1] mass spectrometry and electron spin resonance spectroscopy. There are several methods for measuring the temporal coherence of the light (see:field-autocorrelation), including the continuous wave Michelson or Fourier transform spectrometer and the pulsed Fourier transform spectrograph (which is more sensitive and has a much shorter sampling time than conventional spectroscopic techniques, but is only applicable in a laboratory environment).
The term Fourier transform spectroscopy reflects the fact that in all these techniques, a Fourier transform is required to turn the raw data into the actual spectrum, and in many of the cases in optics involving interferometers, is based on the Wiener–Khinchin theorem.
Conceptual introduction
Measuring an emission spectrum

One of the most basic tasks in spectroscopy is to characterize the spectrum of a light source: How much light is emitted at each different wavelength. The most straightforward way to measure a spectrum is to pass the light through a monochromator, an instrument that blocks all of the light except the light at a certain wavelength (the un-blocked wavelength is set by a knob on the monochromator). Then the intensity of this remaining (single-wavelength) light is measured. The measured intensity directly indicates how much light is emitted at that wavelength. By varying the monochromator's wavelength setting, the full spectrum can be measured. This simple scheme in fact describes how some spectrometers work.
Fourier transform spectroscopy is a less intuitive way to get the same information. Rather than allowing only one wavelength at a time to pass through to the detector, this technique lets through a beam containing many different wavelengths of light at once, and measures the total beam intensity. Next, the beam is modified to contain adifferent combination of wavelengths, giving a second data point. This process is repeated many times. Afterwards, a computer takes all this data and works backwards to infer how much light there is at each wavelength.
To be more specific, between the light source and the detector, there is a certain configuration of mirrors that allows some wavelengths to pass through but blocks others (due to wave interference). The beam is modified for each new data point by moving one of the mirrors; this changes the set of wavelengths that can pass through.
As mentioned, computer processing is required to turn the raw data (light intensity for each mirror position) into the desired result (light intensity for each wavelength). The processing required turns out to be a common algorithm called the Fourier transform (hence the name, "Fourier transform spectroscopy"). The raw data is sometimes called an "interferogram". Because of the existing computer equipment requirements, and the ability of light to analyze very small amounts of substance, it is often beneficial to automate many aspects of the sample preparation. The sample can be better preserved and the results are much easier to replicate. Both of these benefits are important in testing situations that may later involve legal action, such as those involving drug specimens.[2]
Measuring an absorption spectrum

The method of Fourier transform spectroscopy can also be used for absorption spectroscopy. The primary example is "FTIR Spectroscopy", a common technique in chemistry.
In general, the goal of absorption spectroscopy is to measure how well a sample absorbs or transmits light at each different wavelength. Although absorption spectroscopy and emission spectroscopy are different in principle, they are closely related in practice; any technique for emission spectroscopy can also be used for absorption spectroscopy. First, the emission spectrum of a broadband lamp is measured (this is called the "background spectrum"). Second, the emission spectrum of the same lamp shining through the sample is measured (this is called the "sample spectrum"). The sample will absorb some of the light, causing the spectra to be different. The ratio of the "sample spectrum" to the "background spectrum" is directly related to the sample's absorption spectrum.
Accordingly, the technique of "Fourier transform spectroscopy" can be used both for measuring emission spectra (for example, the emission spectrum of a star), andabsorption spectra (for example, the absorption spectrum of a glass of liquid).
Continuous wave Michelson or Fourier transform spectrograph

The Michelson spectrograph is similar to the instrument used in the Michelson-Morley experiment. Light from the source is split into two beams by a half-silvered mirror, one is reflected off a fixed mirror and one off a moving mirror which introduces a time delay—the Fourier transform spectrometer is just a Michelson interferometer with a movable mirror. The beams interfere, allowing the temporal coherence of the light to be measured at each different time delay setting, effectively converting the time domain into a spatial coordinate. By making measurements of the signal at many discrete positions of the moving mirror, the spectrum can be reconstructed using a Fourier transform of the temporal coherence of the light. Michelson spectrographs are capable of very high spectral resolution observations of very bright sources. The Michelson or Fourier transform spectrograph was popular for infra-red applications at a time when infra-red astronomy only had single pixel detectors. Imaging Michelson spectrometers are a possibility, but in general have been supplanted by imaging Fabry–Pérot instruments which are easier to construct.
Extracting the spectrum
The intensity as a function of the path length difference (also denoted as retardation) in the interferometer p and wavenumber  is [3]
is [3]![I(p,\tilde{\nu}) = I(\tilde{\nu})[1 + \cos(2\pi\tilde{\nu}p)]](http://upload.wikimedia.org/math/7/1/a/71a047c5ef9fff3359ad487f785d52a6.png) ,
,
where  is the spectrum to be determined. Note that it is not necessary for to be modulated by the sample before the interferometer. In fact, most FTIR spectrometers place the sample after the interferometer in the optical path. The total intensity at the detector is
is the spectrum to be determined. Note that it is not necessary for to be modulated by the sample before the interferometer. In fact, most FTIR spectrometers place the sample after the interferometer in the optical path. The total intensity at the detector is![I(p) = \int_0^\infty I(p,\tilde{\nu}) d\tilde{\nu} = \int_0^\infty I(\tilde{\nu})[1 + \cos (2\pi\tilde{\nu}p)] d\tilde{\nu}.](http://upload.wikimedia.org/math/7/4/7/7476711ee1b73c217530af3feef44f0e.png)
This is just a Fourier cosine transform. The inverse gives us our desired result in terms of the measured quantity I(p):
![I(\tilde{\nu}) = 4 \int_0^\infty [I(p) - \tfrac{1}{2}I(p=0)] \cos (2\pi\tilde{\nu}p) dp.](http://upload.wikimedia.org/math/6/8/8/688472b5a90fe7d0e5f17cb6e2a36f00.png)
Pulsed Fourier transform spectrometer
A pulsed Fourier transform spectrometer does not employ transmittance techniques. In the most general description of pulsed FT spectrometry, a sample is exposed to an energizing event which causes a periodic response. The frequency of the periodic response, as governed by the field conditions in the spectrometer, is indicative of the measured properties of the analyte.
Examples of pulsed Fourier transform spectrometry
In magnetic spectroscopy (EPR, NMR), an RF pulse in a strong ambient magnetic field is used as the energizing event. This turns the magnetic particles at an angle to the ambient field, resulting in gyration. The gyrating spins then induce a periodic current in a detector coil. Each spin exhibits a characteristic frequency of gyration (relative to the field strength) which reveals information about the analyte.
In Fourier transform mass spectrometry, the energizing event is the injection of the charged sample into the strong electromagnetic field of a cyclotron. These particles travel in circles, inducing a current in a fixed coil on one point in their circle. Each traveling particle exhibits a characteristic cyclotron frequency-field ratio revealing the masses in the sample.
Free induction decay
Pulsed FT spectrometry gives the advantage of requiring a single, time-dependent measurement which can easily deconvolute a set of similar but distinct signals. The resulting composite signal, is called a free induction decay, because typically the signal will decay due to inhomogeneities in sample frequency, or simply unrecoverable loss of signal due to entropic loss of the property being measured.
Stationary forms of Fourier transform spectrometers
In addition to the scanning forms of Fourier transform spectrometers, there are a number of stationary or self-scanned forms.[4] While the analysis of the interferometric output is similar to that of the typical scanning interferometer, significant differences apply, as shown in the published analyses. Some stationary forms retain the Fellgett multiplex advantage, and their use in the spectral region where detector noise limits apply is similar to the scanning forms of the FTS. In the photon-noise limited region, the application of stationary interferometers is dictated by specific consideration for the spectral region and the application.
Fellgett advantage
Main article: Fellgett's advantage
One of the most important advantages of Fourier transform spectroscopy was shown by P.B. Fellgett, an early advocate of the method. The Fellgett advantage, also known as the multiplex principle, states that when obtaining a spectrum when measurement noise is dominated by detector noise (which is independent of the power of radiation incident on the detector), a multiplex spectrometer such as a Fourier transform spectrometer will produce a relative improvement in signal-to-noise ratio, compared to an equivalent scanning monochromator, of the order of the square root of m, where m is the number of sample points comprising the spectrum. However if the detector is shot noise dominated, the noise will be proportional to the square root of the power, thus for a broad boxcar spectrum (continuous broadband source), the noise is proportional to the square root of m, thus precisely offset the Fellgett's advantage. Shot noise is the main reason Fourier Transform Spectrometry was never popular for UV and visible spectrum.
Converting spectra from time domain to frequency domain
Main article: Fourier transform

The sum is performed over all contributing frequencies to give a signal S(t) in the time domain.
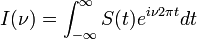
gives non-zero value when S(t) contains a component that matches the oscillating function.
Remember that
Remember that
See also
References
- ^ Antoine Abragam. 1968. Principles of Nuclear Magnetic Resonance., Cambridge University Press: Cambridge, UK.
- ^ Semiautomated depositor for infrared microspectrometryhttp://www.opticsinfobase.org/viewmedia.cfm?uri=as-57-9-1078&seq=0
- ^ Peter Atkins, Julio De Paula. 2006. Physical Chemistry, 8th ed. Oxford University Press: Oxford, UK.
- ^ William H. Smith U.S. Patent 4,976,542 Digital Array Scanned Interferometer, issued Dec. 11, 1990
No comments:
Post a Comment